Visualizing Open Source Project Commit Histories
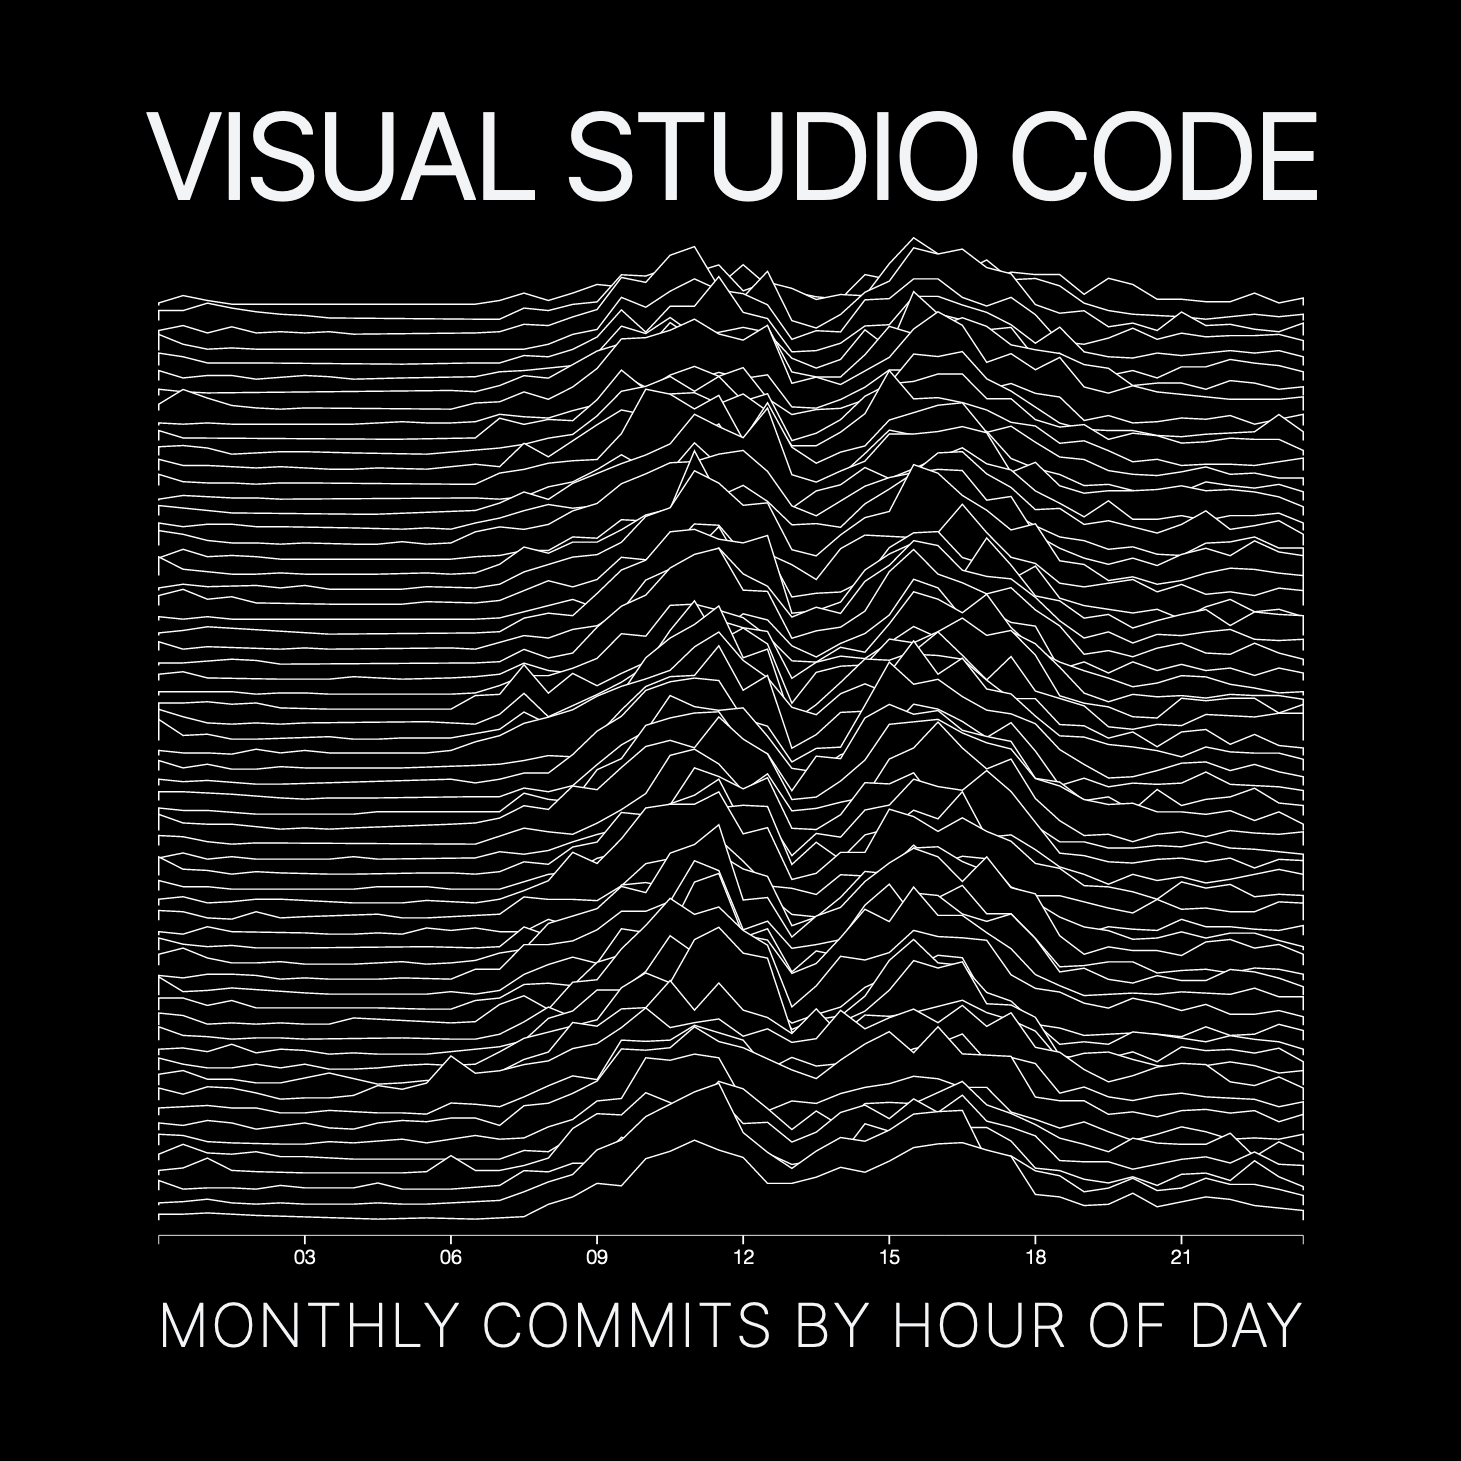
Recently, I came across this excellent interview with the graphic designer Peter Saville describing the origin of Joy Division's famous cover for Unknown Pleasures. I decided to recreate the visual form of the image using open source project commit histories, including VSCode, React, TensorFlow, and Git itself.