The 2013 Felton Volume Chart
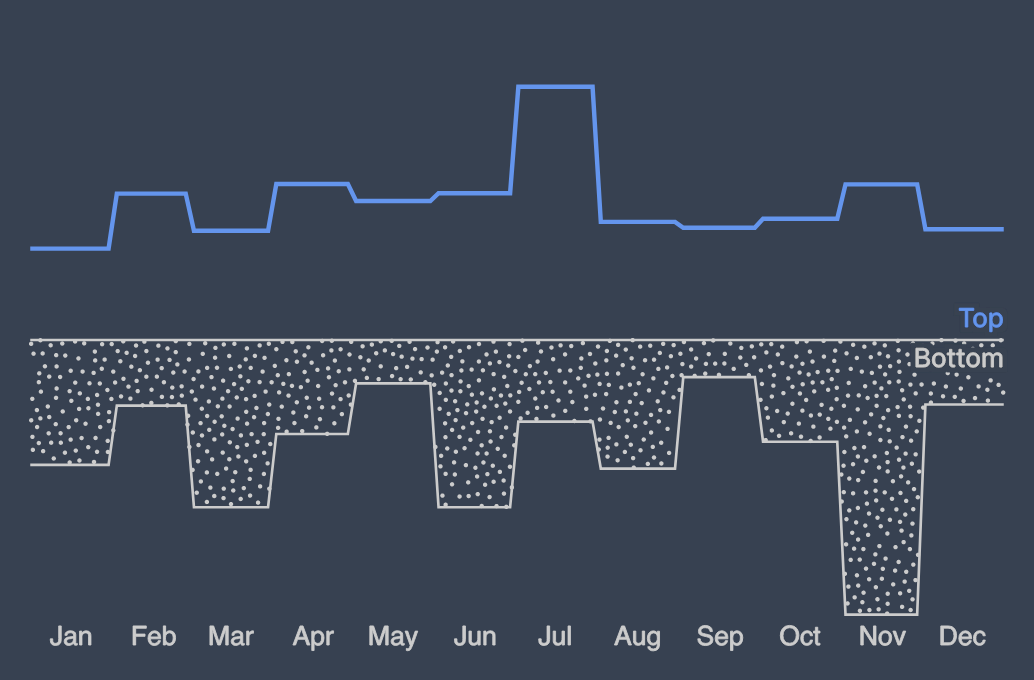
This final post in my series on how I created the visualizations in my Visual Studio Code 2020 Year in Review covers how I recreated the "volume chart" from Nicholas Felton's 2013 Annual Report.
This final post in my series on how I created the visualizations in my Visual Studio Code 2020 Year in Review covers how I recreated the "volume chart" from Nicholas Felton's 2013 Annual Report.
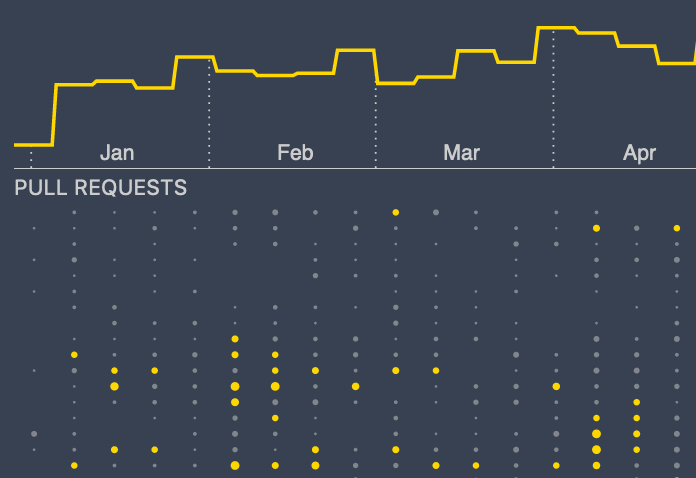
Using D3 and Svelte to implement the first variant of the Felton 2013 histogram.
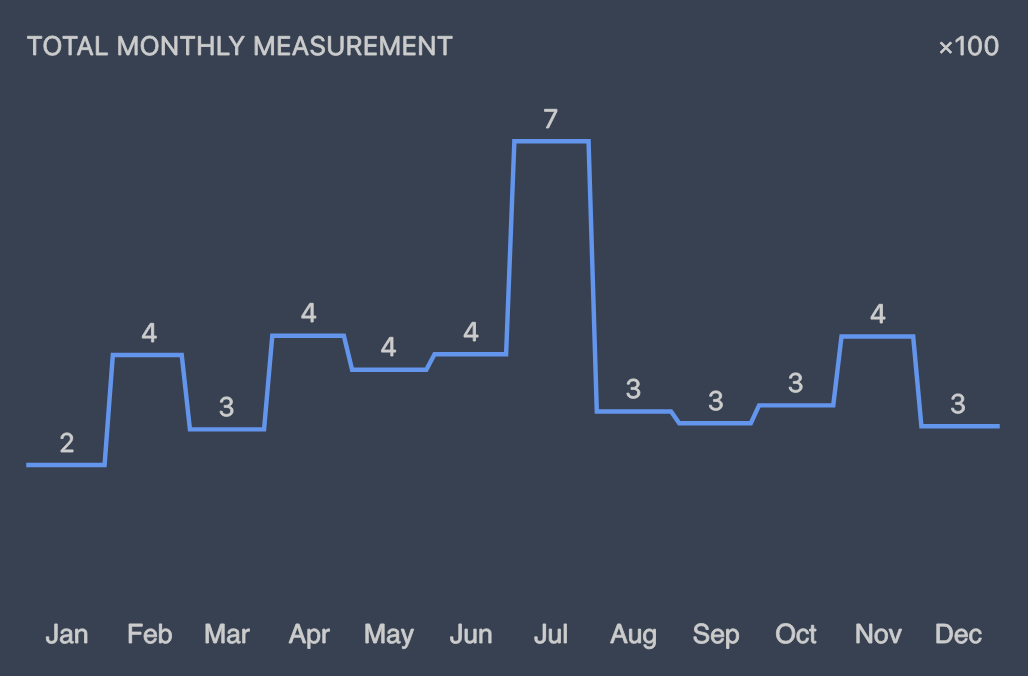
Using D3 and Svelte to Implement the Felton 2013 Bar Chart
The inspiration behind my Visual Studio Code 2020 Year in Review visualization, and how I went about building it.
Using D3 and Svelte to implement the second variant of the Felton 2013 histogram.