Nicholas Felton’s 2013 Annual Report contained two distinct histogram variants. This post covers how I created the first variant, which looks like this:
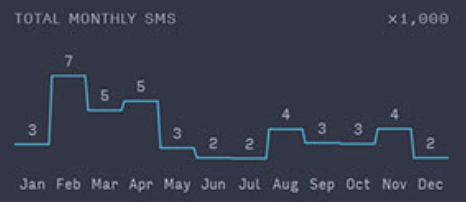
Histogram (Variant 1) detail from 2013 Annual Report (Nicholas Felton)
A pretty typical histogram. However, the styling aspects are what I found most interesting:
- Truncated measure labels with a scale factor in the upper-right corner
- Slanted measure transition lines that join the entire series of measurements into a single line
I’ll cover how I achieved both of these below.
Truncated Measure Labels
This was pretty straightforward, as there’s a math function that can be used directly to determine how many significant digits you need to represent a number: Math.log10. The log10 function calculates the base 10 logarithm of a number, which can be used to calculate the number of digits within it. For example,
Math.log10(623) = 2.7944880466591697
The scale factor is calculated by using the whole part of the result (using Math.floor) as the exponent in a call to Math.pow.
| |
The minimum value was used to ensure that the labels weren’t unnecessarily “flattened” by a scale that was off by a factor of 10 (or more), and D3’s formatting functions were used to discard the fractional part of each measure.
Inside the SVG, the measure labels were added using text elements:
| |
The title and scale indicator was added using additional text elements:
| |
Measure Transitions
I implemented two separate line styles while building this visualization. The first used the built-in D3 line generation tools, and the second used a custom line generator.
First Attempt Using D3 Curves
At first I tried to use the line function to generate a segmented line that represented the measures in the histogram. There is a curve function that can be used to specify how points in a line should be joined, and in particular curveStepAfter seemed like it might do the job.
💣 However, in order for this to work I needed to ensure that there was one extra entry in the data, or D3 wouldn’t create the final flat value segment. I simply copied the last point and set the date to one month in the future.
| |
This resulted in the following:

First attempt using D3 line and curveStepAfter
This was actually a pretty good starting point, and was what I used until I had time to revisit the visualization.
Second Attempt Using Custom Line Generator
Once I had a little more time to revisit my first attempt, I decided to implement the slanted segment connectors that were used in the original.
I had to replace the use of the line built-in x and y functions with a custom function that took the spacing between measured values into consideration. My goal was to allocate 5% of each measure line at the start and end to be used for the transition. As a result, each line segment was drawn by creating a horizontal line for the measure itself, and then creating a line from the end of that measure to the start of the next. This logic is contained in the following function:
| |
Once that was done I could create the measure line as follows:
| |
Resulting in a much-improved (in my opinion) final version of the visualization:
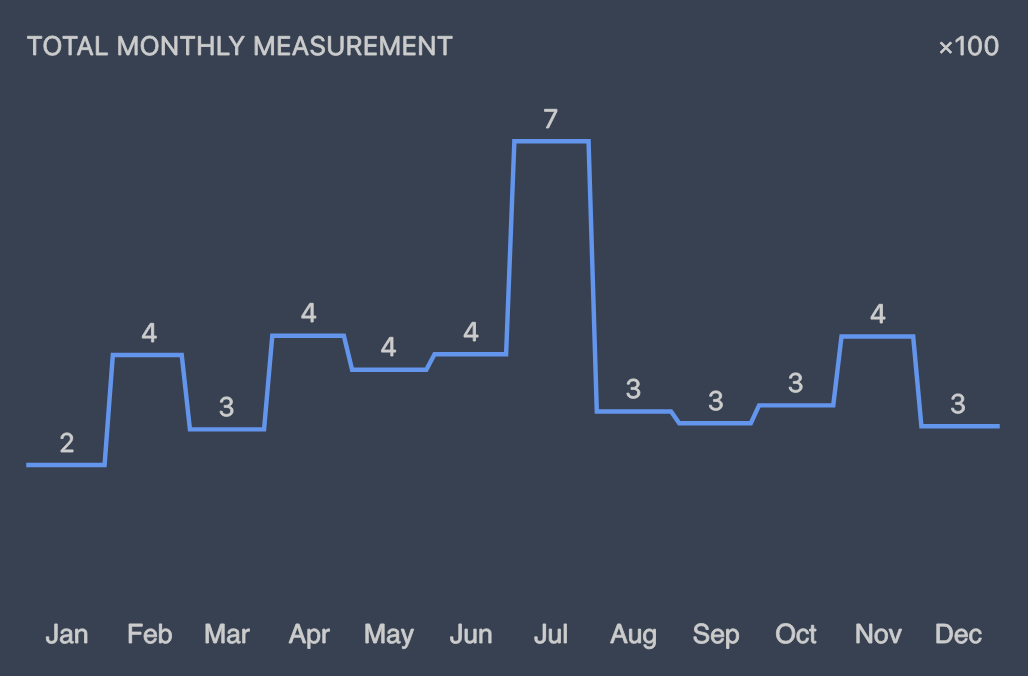
Final histogram version - variant 1
The code I used to write this post is available on GitHub.
Please feel free to contact me if you have any questions or comments.